Python pandasで読み取ったCSVを加工するその②
こんにちは。ちゃあ少佐です。
Python 学習19日目
今回はHeightMの列と
HeightMの列に㎝⇒Mに変換して追加します。
※CSVからの読み込みは省略します。
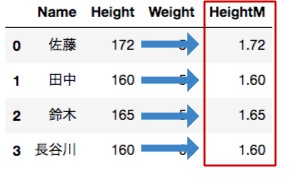
df['HeightM'] = df['Height'] / 100
※これでHeightMの列と値が作成されます。
さらにBMIの列と値を追加してグラフ化!
df['BMI'] = df['Weight'] / df['HeightM']**2
%matplotlib inline
import matplotlib.pyplot as plt
# 日本語フォントとサイズを指定
plt.rcParams['font.family'] = 'TakaoGothic'
plt.rcParams['font.size'] = 14
# BMIをグラフで表示
df'BMI'.plot.bar()
plt.xticks(df.index,df.Name);

からの~~~
BMI25以上又は18未満の人を表示させる。
df_filtering = df[df['BMI'] >= 25]
print(df_filtering)
結果
Name Height Weight HeightM BMI
0 佐藤 172 53 1.72 17.915089
3 長谷川 160 65 1.6 25.390625
以上、ちゃあ少佐でした。